
Somewhere in your delivery organization there is a slide with two numbers on it and a definition underneath explaining cycle time vs lead time. The definitions are correct. The improvement being reported against one of them is real, and somebody worked hard for it. And the sponsor three seats down the table, who asked for the thing in February and saw it go live in July, has noticed no difference whatsoever. All three of those statements are true at the same time, and the reason they can be is the most useful piece of measurement in portfolio delivery that almost nobody uses.
The pair came into project work from lean manufacturing and from Kanban, and the people who brought it are right about it. Measured together, the two numbers are the best diagnostic instrument in delivery. Nothing here argues with the definitions. The argument is about which of the two travels upward through an organization, which of the two has money attached, and the fact that in most portfolios those are not the same number.
Here is the whole idea in one line. One of those clocks starts on a date your organization chooses. The other starts on a date the customer remembers. That single difference decides whether a delivery improvement is a real one or an accounting one, and it is why a portfolio can produce a genuine, verified, hard won improvement in how fast it works and still deliver nothing sooner than it did last year.
So the useful question is not the textbook one. Anybody can recite cycle time vs lead time. The question worth an hour of a portfolio board's time is which of the 2 your drag cost runs on, drag cost being the value your portfolio gives up for every week a project arrives later than it could have. The answer is lead time, always. Flow time, the Flow Economics name for how long a piece of work is alive from the moment the organization accepted it to the moment it is in use, is lead time measured honestly and then priced. Cycle time is a diagnostic. Only one of the two has a dollar figure attached to the clock, and it is not the one on your dashboard.
What is the difference between cycle time and lead time?
Lead time is the whole wait: from the moment a request is accepted to the moment the result is in use. Cycle time is the shorter span, from the moment work actually starts on that request to the same delivery. The difference between the two is queue time, and in most portfolios it is the larger part.
That means there are three clocks in play, not two, and reporting goes wrong because the third one has no owner.
1. Lead time. Accepted request to in use. This is what the customer experiences and the only one of the three they can feel. Your drag cost runs on this clock, and so does every benefit case that assumed a go live date.
2. Cycle time. Work started to in use. This is the span your delivery teams can actually influence, which is exactly why it is the one they are measured on and the one they report.
3. Queue time. Accepted request to work started. Lead time minus cycle time. No team owns it, no status report contains it, and it is usually bigger than the other two put together.
Definitions vary in the wild, and it is not worth a fight. Some organizations say delivery lead time for what is described here as cycle time; manufacturing and Kanban use the words differently again. Pick one set, write it down, and put the definition on the slide. The trap is not which words you choose. The trap is reporting the short clock upward and never the long one.
Why does the cycle time vs lead time gap matter at portfolio level?
Because the gap is where the money is, and the gap is not on anybody's plan.
Take a single project and price its wait. A broker pricing feed at Calder, a mid sized insurer, was worth about $38,000 a week once live. The request was accepted on 6 February. Work started on 11 May. It went live on 26 June. That is a lead time of 20 weeks, made of thirteen and a half weeks of queue and six and a half weeks of cycle.
Multiply each span by the drag cost and it stops being a measurement problem.
- Value given up while the work was being done: 6.5 weeks at $38,000, so $247,000.
- Value given up while the work sat waiting to start: 13.5 weeks at $38,000, so $513,000.
- Share of the total loss that happened before anybody touched the work: 68%.
Two thirds of what that project cost the business in lateness was incurred in a period no delivery report covers, by a process nobody is accountable for, and about which no meeting was held. The six and a half weeks that everybody watched, staffed, chased and escalated were the cheaper third.
This extends a number the discipline already has. Flow efficiency compares the hours a piece of work was actively advanced against the time it was alive, and the answer is routinely between five and fifteen percent. Measured from the accepted request rather than from kickoff it is lower still, often by a factor of three, because the denominator triples and the numerator does not move. Most organizations quoting a flow efficiency figure are quoting it against cycle time, which is the flattering version.
The start line is a choice, not a measurement
Here is the part that matters, and the reason cycle time cannot carry a delivery promise. Cycle time's clock starts when work starts, and when work starts is an administrative decision your organization takes. There are three ordinary ways to move that number without anything arriving sooner.
Start later. Hold work in intake until the inputs for it genuinely exist, and cycle time falls while queue time rises by the same amount. This is often exactly right, and the discipline recommends it under the name full kit. Notice what happens to the report, though: the cycle time improves for a reason that has nothing to do with working faster.
Start earlier. Open work the moment it is accepted, and queue time goes to zero while cycle time inflates to the full 20 weeks. Nothing about the organization's performance has changed. The waiting has moved from one side of the start line to the other, where it is now visible, and a team that was reporting six and a half weeks is reporting 20. In practice it is worse than neutral, because work that is open gets touched, and touching many things at once costs throughput rather than moving any of it.
Redefine the start. The clock starts at the first sprint. Or when the project manager was assigned. Or at the re-baseline, which discards the first 4 months. No dishonesty is required for this to happen. A definition simply gets chosen by whoever builds the report, in a month when the number needs to look better.
Underneath all three is one piece of arithmetic that settles the question. Little's Law says that for any stable system, the average time an item spends in it equals the amount of work in the system divided by the rate at which the system completes work:
lead time = accepted work in the system / throughput
Cycle time does not appear in that equation. So a cycle time improvement that does not raise throughput, and does not reduce the amount of accepted work sitting in the system, cannot change lead time by a single day. It can only relocate the wait. That is not a criticism of the improvement. It is a statement about what the improvement is able to promise.
A worked example: where a fifth off the cycle time went
Calder's change portfolio runs everything through a group of six data engineers. They are the constraint: nothing reaches production without them and everything queues for them. Each contributes about 30 productive hours a week across 46 working weeks, so the portfolio has 8,280 constraint hours a year, and that figure, rather than the budget, is its real capacity to deliver change. An average project draws about 450 of those hours, which sets throughput at roughly 18 projects a year, or 0.4 a week. At a value per constrained resource hour of $950, the group's output is worth about $7.9 million a year.
Last year the delivery teams did a good piece of work. Environment provisioning was automated and test data was standardized, which removed real waiting from inside every started project. Average cycle time fell from 8.0 weeks to 6.5, a fifth, verified from timestamps rather than asserted. It was announced, and it deserved to be.
Lead time did not move. It was 20 weeks before and it was 20 weeks after.
The reason is in the equation. The improvement removed waiting inside the start line, but it did not change how many constraint hours a project needs, so throughput stayed at 0.4 projects a week. Intake did not change either, so the portfolio still carried about eight accepted and undelivered projects at any moment. 8 divided by 0.4 is 20 weeks, before and after. The one and a half weeks that came out of the cycle went into the queue, which grew from 12 weeks to thirteen and a half. Every project now waits longer to start, then finishes faster, and arrives on precisely the same day.
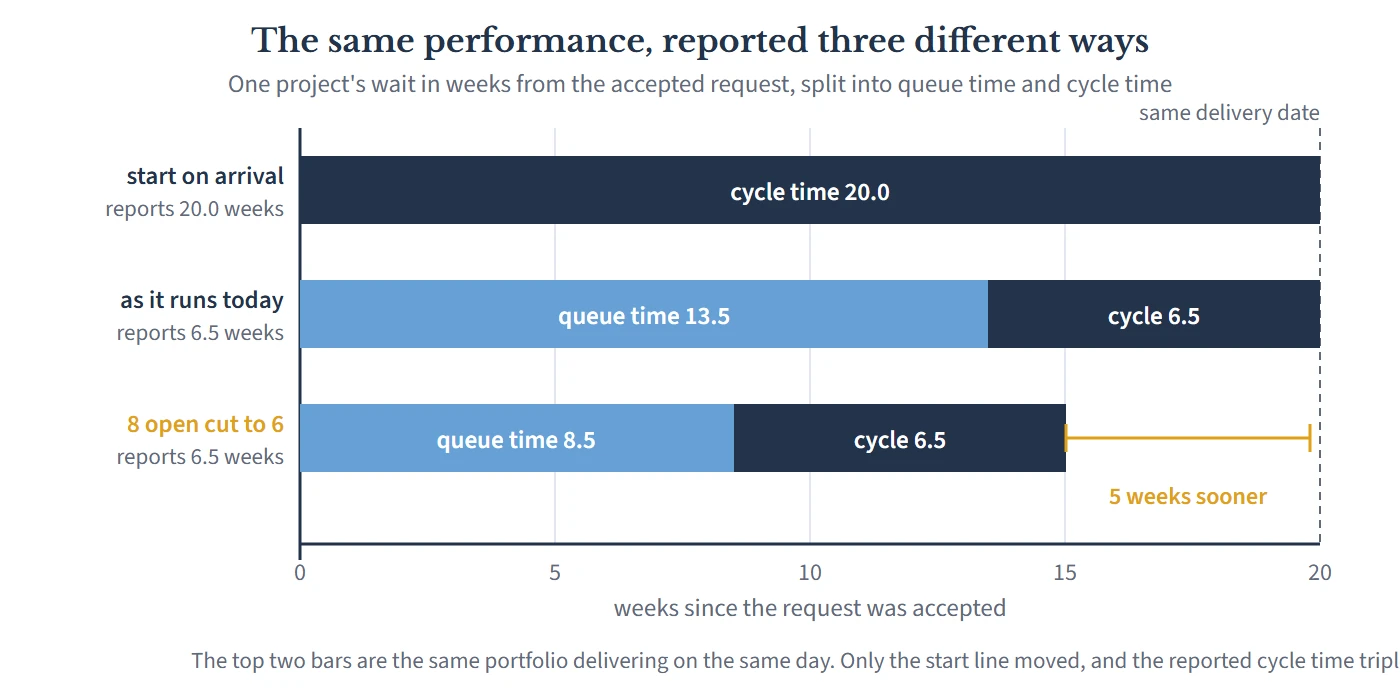
Now change the only two terms the equation actually contains. Throughput is set by the constraint, and raising it costs money, time and usually a dip in delivery before it pays. Accepted work in the system costs nothing to change, because it is a decision about how much the portfolio says yes to at once.
Hold accepted work at six projects instead of 8 and the arithmetic gives a lead time of 15 weeks. Cycle time is untouched at 6.5. The queue falls from 13.5 weeks to 8.5.
- Every project arrives about 5 weeks earlier than it would have, permanently, from the point the new level is reached.
- On the broker pricing feed, 5 weeks at $38,000 is $190,000.
- Across 18 projects a year at an average drag cost of $11,000 a week, it is a little under $1 million a year of value brought forward.
- Additional capacity required: none. Additional spend: none.
Two honest qualifications. First, you do not get from eight to six by announcing it. You get there by accepting new work more slowly than you deliver for a couple of months, which means telling two sponsors "not yet" and holding the line while the level drains. That is the entire cost of the change, and it is paid in awkwardness rather than money. Second, the estimate is deliberately conservative: it assumes throughput stays at 0.4 projects a week when work in progress falls, and in practice throughput rises, because people switching between fewer things lose less of the day to switching.
Why single project management is blind to this
A project cannot report the time it spent waiting to become a project. Its reporting begins at its own kickoff, its plan begins at its own kickoff, and its first status report is written by somebody who was not on it during the 13 weeks that cost the most. The instrument starts after the expensive part is over, so the expensive part is not in the data, and a portfolio made entirely of well run projects can be very slow without a single red status anywhere in it.
The queue is also structurally unownable in a project world. It sits between projects, and everything between projects belongs to nobody, which is the Project Illusion doing what it always does: every part of the system is managed competently and the thing that governs delivery speed sits in the space between the parts. A delivery team that halves its cycle time is rewarded for it. A portfolio that halves its queue time moves every delivery date by twice as much, and has no forum in which to mention it.
And the queue is not dead time. It is where your organization's decisions live: the approval that took 5 weeks to schedule, the sequencing argument nobody wanted to have, the sponsor who was on leave. That is decision latency, and it is the component of queue time that costs nothing to fix and gets fixed last. Because none of it appears on a plan, none of it ever turns red, which is the same blindness that produces the watermelon report from the other direction.
What to do instead
1. Define the accepted request date once, in writing. Not the date somebody first mentioned the idea, and not kickoff. Use the date the organization accepted the request as real, which is a minuted decision: entry onto the candidate list. One definition, applied to everything, published where the metric is published. A clock that can be renegotiated is not a clock.
2. Report the pair, always, plus the ratio. Cycle time alone is unreadable. Publish lead time, cycle time, and queue share, which is queue time divided by lead time. Calder's is 68%. Anything above 50% means team level speed work is not your best available lever, whatever else is true.
3. Price the queue on the same page as the metric. Queue weeks multiplied by drag cost, per project and totaled for the year. A number in weeks is a reporting line. The same number in dollars is a decision. If you have not priced an hour of your constrained team yet, that calculation comes first, because none of this arithmetic exists without it.
4. Accept a cycle time improvement as a delivery promise only when one of two things is true. Either throughput at the constraint rose, or accepted work in the system fell. If neither did, the improvement is real and the delivery promise is not, and somebody should say so out loud in the meeting where the improvement is announced. Improvements away from the constraint do not raise throughput at all, which is the non constraint trap.
5. Set the lead time you want and solve for the work in progress that produces it. This inverts the usual argument, and it is the most useful single move in this piece. Decide the promise: 15 weeks from accepted request to live. Multiply by throughput, 0.4 a week, and you get 6. Six is now the number of accepted and undelivered projects your portfolio is allowed to carry, and it is defensible in a way that a work in progress limit chosen by feel never is. You are not rationing ambition. You are declining to promise a 15 week lead time while carrying 20 weeks of accepted work.
6. Give the two clocks two owners. Delivery teams own cycle time, because they can move it. The portfolio board owns queue time, because it is the only body that can. Both numbers appear in the same pack every month. Nobody is then measured on a number they cannot change, and nobody gets to ignore a number because it belongs to somebody else.
The objection you are already forming
"Lead time is not a fair measure of my team. The clock starts months before we are allowed to touch the work, and half of that period is governance I do not control. And your accepted request date is exactly as gameable as my start date: all you have done is move the argument."
Both halves of that are right, and the second half is the better point.
On fairness: nothing here proposes holding a delivery team accountable for lead time. That is what recommendation six is for. Cycle time is the right number for a team, and it is right precisely because they can move it. What is not defensible is letting the team's number stand in for the customer's wait when it covers 32% of it. Two clocks, two owners, both published.
On gaming: yes, the accepted request date can be manipulated, and there is only one way to do it, which is to refuse to accept requests. Consider what that means. Gaming cycle time requires nothing but a reporting choice made inside a delivery function. Gaming lead time requires a portfolio board to decline work in the open, in a minuted meeting, in front of the sponsor. That is not a loophole, it is the decision you were trying to get made. A measure whose only available abuse is a visible act of prioritization is a well designed measure.
There is one case where the objection wins on its own terms. If your portfolio genuinely does not accept requests until it is ready to start them, queue time is near zero, and lead time and cycle time converge. Some small single team operations run this way, and for them this piece describes a problem they do not have. Check before assuming it, though: measure from the date the sponsor's need was accepted rather than the date the ticket was created, and the queue you thought you did not have is usually sitting in a spreadsheet somebody keeps outside the system.
What changes when you get this right is not the speed of the work. The work was never especially slow. What changes is which number the organization argues about. A portfolio that reports cycle time argues about team performance, which is largely not the problem and cannot be improved much further. A portfolio that reports lead time next to its drag cost argues about how much it has said yes to, which is the actual lever, is free to pull, and belongs to the people already in the room.
If you have not yet identified which resource sets your delivery speed, start with How to Find the One Resource That Sets Your Delivery Speed, because the throughput term in every calculation here comes from it. For why holding less open work delivers more, see Start Less to Finish More. And for the price of the waiting itself, read Drag Cost: The Hidden Price of Project Delay.

Leave a Reply