
Somewhere in your capacity plan there is a row that reads something like "Design Authority: 6.0 FTE, 80% utilized". Everything in that row is accurate. The six people exist, the hours are right, the arithmetic behind the percentage is sound, and if you checked it against timesheets it would hold up.
The row is still wrong, and it is wrong in a way that costs more than most of the things your portfolio argues about. What is wrong is the word "team". Work does not arrive at that team. It arrives at a name. The payments platform package goes to the person who knows the payments platform, and if she is busy it waits, and it waits even on the afternoon when two of her five colleagues have nothing urgent in front of them, because neither of them can take it.
You do not have a team of 6 running at 80%. You have 6 teams of one, each running at 80%, and those 2 things behave so differently that no capacity model built on the first will ever predict the delays produced by the second.
The standard answer is cross training employees, and it is the right instinct: a second person who can take the work is exactly what that row is missing. Where it usually goes wrong is that cross training is run as a skills program, spread evenly and measured in courses completed. What matters is narrower: how many people could take each kind of work this week, on the specific packages that queue.
The gap between them has a name worth using, because the thing it measures is both large and nearly free to collect. Call it the pooling dividend: the throughput your organization already owns, has already paid for, and cannot collect, because each piece of work can only be done by one specific person.
The third dial
Flow Economics has already taught two of the three things that decide how long work waits.
The first is utilization. The Utilization Trap showed that waiting time rises as utilization over one minus utilization, so the curve bends upward and goes vertical as a resource fills. The second is unevenness. The Variability Tax showed that lumpy arrivals and uneven item sizes multiply that curve, and that the two terms compound rather than average.
There is a third term sitting in the same queueing equation, and in portfolio management it gets almost no attention at all. It is the number of servers: how many people could actually pick up the item when it arrives. Call it coverage depth. Most organizations have never measured it, do not have it on any report, and could not tell you its value for their own constraint this morning.
Here is why it matters more than its obscurity suggests. Pooling a queue is not a linear improvement. Two people sharing one queue do not simply halve the wait of two people running separate queues at the same utilization. They do considerably better than that, because the idle moments of one absorb the peaks of the other, and it is the peaks, not the averages, that make queues long.
Put numbers on it. Take a gate where an average item needs 8 working days of a specialist's time, and where the specialists are 80% utilized. Hold the capacity, the workload and the utilization constant, and change nothing but how many people can take an item:
- One possible owner: average wait of 32.0 working days.
- Two: 14.2 working days.
- Three: 8.6 working days.
- All six: 3.5 working days.
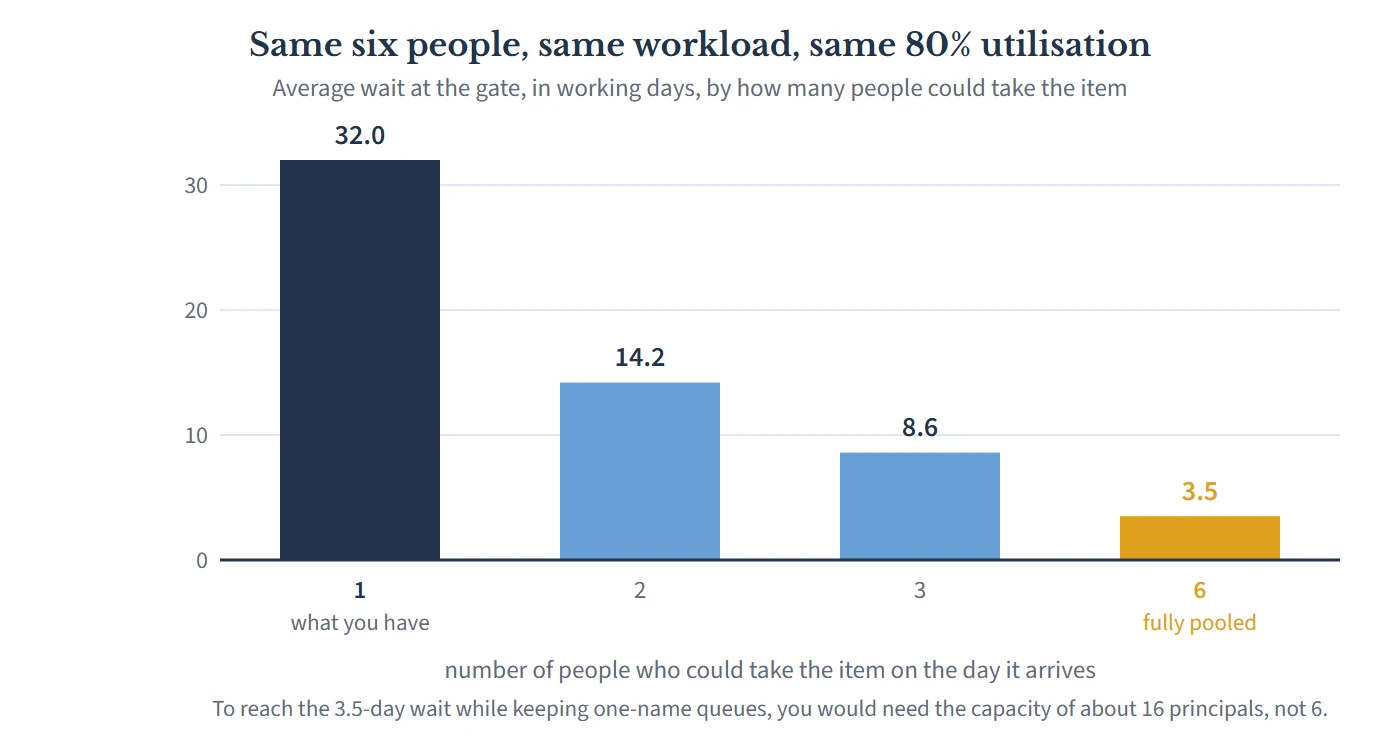
Sit with the first and the last of those numbers for a moment. They describe the same six people, doing the same volume of work, at the same measured utilization, on the same days. The wait differs by a factor of nine. Every report your organization produces would show those 2 situations as identical, because every report you receive aggregates up to the row that says 6.0 FTE at 80%.
A worked example
Numbers make the shape concrete. These are illustrative, but the pattern is one I have watched play out repeatedly.
A change portfolio runs every significant design decision through six principal engineers. They are the constraint: no project of any size gets built without a package passing through them. Each principal owns a domain, which is how it has always been, and which is entirely sensible, because domains take years to learn. An average package needs about eight working days of a principal's time. Each domain receives about 23 packages a year against 230 available working days, so each principal runs at 80%, which the capacity team correctly reports as busy but survivable.
The portfolio holds 18 projects in flight, each running about 18 months, so roughly 12 complete a year. An average project sends about 12 packages through the gate over its life, of which about three sit on the critical path. An average project, once live, returns about $2.6 million a year, which makes its drag cost about $11,300 for every working day it lands late.
Now the arithmetic that nobody runs.
Each critical package waits 32 working days before anyone starts it, then takes eight. Three of those per project is 96 working days, about four and a half months of an 18-month schedule, spent sitting in a queue in front of 6 people who are, on any given day, 20% idle. Not idle on your work: idle on the work they alone are permitted to do.
Now give each principal genuine coverage of one other domain, so that any package has two possible owners rather than one. Change nothing else. No hiring, no process reform, no expediting, no reduction in variability, and no change in utilization.
- Wait per package falls from 32.0 to 14.2 working days.
- Per project, across three critical packages, that is 53 working days recovered, about 11 working weeks.
- At $11,300 a day, each project delivers about $600,000 of value earlier than it otherwise would.
- Across 12 projects a year: about $7.2 million a year.
There is a second way to read the same gain, and it is worth doing, because it lands differently with different audiences. Cutting 53 working days off an 18-month project takes average cycle time to about fifteen and a half months. Hold work in progress at 18 projects, apply Little's Law, and throughput rises from 12 completions a year to about 14. Two more projects a year, from the same people. That is the same dividend counted a second way rather than an additional one, so do not add them together, but notice that one version is a finance argument and the other is a delivery argument, and you will need both.
The capacity you would have to buy instead
The instinct, faced with a 32-day queue, is to ask for another principal. It is worth pricing that instinct properly, because it is the comparison that settles the argument.
A seventh principal, hired into a seventh domain, moves none of the six existing queues at all. This is the non-constraint trap in its most expensive local form: capacity added where it cannot reach the work that is waiting.
A seventh principal added to the busiest existing domain does help, but look closely at what has actually happened. You have not raised capacity in any way that matters to the other five queues. You have created a pool of 2 in one domain, which is the same mechanism this article is about, bought at $210,000 a year rather than for nothing.
And then the comparison that should end the discussion. To get the wait down to 3.5 days while keeping one name on every queue, each principal would have to run at about 30% utilization instead of 80. That is not a discount on headcount, it is a multiplier: it would take the capacity of about 16 principals to do with separate queues what six can do with a shared one. 10 extra people, over $2 million a year, to buy something that routing gives you for the price of some structured shadowing.
That is the general shape of it, and it is why coverage depth deserves a place next to utilization on your dashboard. Capacity is expensive and slow. Routing is cheap and fast. Most portfolios have spent a decade arguing about the first and have never once looked at the second.
Why single-project management is blind to this
Ask which project should have paid for the cross-training, and the question answers itself.
A project manager waiting 32 days for a design package experiences that wait as a fact about the world. She raises it, escalates it, puts it on the risk register as "design authority capacity", and is told, accurately, that the team is at 80% and there is no headcount. She is not wrong about anything, and nothing she can do from inside her project will change the number, because the number is not produced by her project. It is produced by a routing rule that no project owns.
Now look at the funding side. Coverage costs real capacity: the learner's time, the owner's time, and a period of slower work while a second person gets up to speed. In the example above, giving each principal one neighbouring domain costs roughly 96 principal-days, about 7% of a year. No single project can justify that spend, because a project that paid the full cost would capture about one twelfth of the benefit. The remaining 11 twelfths go to other people's projects, most of which have not started yet. Anything whose benefit accrues to the flow rather than to a deliverable is unattributable, and anything unattributable is unfundable.
This is the Project Illusion in a specific and expensive form. The illusion holds that a portfolio is a set of independent projects, each responsible for its own performance. Under that assumption a delay is a project's problem and capacity is a resourcing problem, and there is no place at all for a category of loss that belongs to the way shared work is routed. So the loss goes unowned, unmeasured and uncorrected, year after year, while everybody involved does their job properly.
There is a second reason it stays invisible, and it is worth naming because it is fixable this week. Every capacity system in common use aggregates people into teams and reports a percentage. Aggregation is precisely the operation that destroys the information you need. A team of 6 at 80% and 6 queues of one at 80% produce an identical row, and the row is the only thing anybody sees.
Cross training employees: you do not need generalists, you need a chain
The objection arrives immediately when this is proposed, and it is a reasonable one: domains take years to learn, and an organization of specialists that converts everybody into a generalist will lose the depth that made the specialists valuable in the first place. Agreed. Complete flexibility is neither achievable nor desirable, and pursuing it is the fastest way to discredit the whole idea.
Fortunately the arithmetic does not ask for it. This is one of the most useful results in the flexibility literature, from work done on manufacturing plants by Jordan and Graves in the 1990s, and it deserves to be far better known in portfolio management than it is.
If each person can cover exactly one additional area, and you arrange those overlaps into a single closed loop rather than into isolated pairs, the system captures most of the benefit of total flexibility. In our example, A covers B's domain, B covers C's, and so on round to F covering A's. Nobody has learned more than one extra domain. Nobody has become a generalist. But because the loop is closed, a surge anywhere can be relieved by a chain of small reassignments that reaches all the way round, and the queueing behavior lands much closer to the fully pooled 3.5 days than to the 14.2 days that 3 isolated pairs would give you.
These are the practical consequences, and they are what make this affordable:
- Two levels of coverage buys most of the dividend. The jump from one possible owner to two is by far the largest single step, and it is also the cheapest one you will ever buy.
- The topology matters as much as the amount. The same quantity of cross-training, arranged as three separate pairs or as one closed loop, buys noticeably different results. Most organizations, left to themselves, produce neither: they produce a scatter of accidental overlaps, plus one or two people who can cover almost everything and are therefore permanently interrupted.
- You are buying an option, not a rota. Nobody is asking the principals to stop specialising. They carry on doing their own domain almost all of the time. The coverage exists to be used on the days when the queue is uneven, which is most days.
What to do instead
1. Measure coverage depth before you do anything else. Take last quarter's work log for your constrained resource and, item by item, ask how many people could have taken this on the day it arrived, without a handover costing more than half a day. Not who did take it: who could have. Publish the histogram. In most organizations, somewhere between half and three quarters of all items turn out to have had exactly one possible owner, and that single slide is the shortest route to funding everything else in this list.
2. Stop reporting your constraint as one utilization figure. A team-level percentage is the aggregation that hides the problem. Report utilization per queue, alongside the coverage depth of that queue. Two numbers instead of one, both of which you already have, and the pairing immediately identifies your most dangerous position: high utilization at depth one.
3. Build a chain, not a pile of pairs. Map your work into the smallest number of coherent classes, put a primary owner on each, then design a single closed loop of secondary coverage across all of them. Write it down and make it explicit rather than hoping it emerges. The design takes an afternoon, and it is the difference between most of the dividend and a fraction of it.
4. Buy coverage in thin slices, and expect to pay before you collect. Cross-training consumes constraint capacity, which means that while you are doing it your queue gets worse. In the worked example, spending that 7% inside a single year would push effective utilization to 86% and stretch the wait from 32 days to about 49 before it improves. This is the hiring dip in miniature, and because the waiting curve is convex the right response is to spread the investment across 18 months to 2 years rather than declaring a training quarter. Complete one pairing at a time, because each finished pairing starts paying immediately.
5. Route to the queue, not to the person. Coverage is worthless if your intake still addresses work to an individual. Requests should arrive at a class of work, be visible to everyone who covers that class, and be assigned at the moment somebody becomes free rather than months earlier when the plan was written. This change is usually harder than the training, because it removes something senior people value, which is control of their own backlog.
6. Price coverage depth into every capacity case you see. When somebody asks for a new specialist, ask what coverage depth their class of work currently has, and what raising it to two would cost. Convert both to value per constrained resource hour and compare like for like. You will approve fewer hires and get faster delivery, and you will have the arithmetic that says why.
7. Treat depth one as a risk with a price, not as a virtue. Most organizations celebrate the person who is the only one who can do the critical thing. In queueing terms that person is a permanent tax on everything that touches their domain, and in ordinary terms they are an unpriced dependency who will eventually take a holiday, a promotion, or a job somewhere else. Neither observation is about the person. Both are about a structure that nobody designed.
The objection you are already forming
"This is a model. My people are not interchangeable servers in a queueing system, my domains genuinely take 3 years to learn, and a package handed to the wrong principal comes back slower, or worse, or both. The 3.5 days is a fantasy."
Largely fair, and worth taking seriously in three parts.
The model is idealised, and the headline numbers assume a second owner who is as fast as the first. They will not be. Suppose your second owner works at 70% of the primary's pace and takes only the third of items that genuinely suit them. You lose a meaningful slice of the gain, and 14.2 days might in practice be 18. Notice what survives the haircut. The comparison is not against 14.2 days. It is against 32, and it remains the cheapest large improvement available to you. Queueing formulas of this kind are poor at predicting a precise number and very good at predicting a direction and an order of magnitude, which is all that is being claimed here. Yours is not 32 days. The shape of yours is 32 days.
On the 3 years: that is an argument about which work, not about whether. No serious version of this proposal asks a second principal to take the hardest novel design in an unfamiliar domain. It asks them to take the 60% of packages that are variations on decisions already made, where the domain knowledge required is real but bounded. Sort your work by how much irreplaceable context it actually needs and you will usually find a large, dull, high-volume band at the bottom that is currently queueing behind the hard cases for no reason other than that it arrived addressed to the same name. Moving only that band captures much of the dividend and touches none of the expertise you are protecting.
And on interchangeability, which is the deepest version of the objection: the specialisation is not the problem. The routing rule is the problem, and a routing rule is a rule, not a fact about the world. Nobody ever decided that the payments platform package must wait for one specific person while her colleague has a slow week. It emerged, sensibly, one reasonable assignment at a time, back when there were 2 projects rather than 18, and it has never been examined since, because it does not appear anywhere that gets examined.
Your delivery speed is being set, to a first approximation, by an undocumented convention about who is allowed to pick things up. It is not in your capacity model, it is not on your risk register, it did not come from a decision anybody remembers taking, and it is costing you more than the last three efficiency programs returned between them. You can measure it this month, and most of what you find will be correctable without spending a penny on headcount.
If you have not yet established which resource sets your delivery speed, start with How to Find the One Resource That Sets Your Delivery Speed, because coverage depth is only worth measuring on the constraint. For the other two dials in the same equation, see The Utilization Trap and The Variability Tax. And if you want to understand why queues in front of your scarcest people dominate your delivery dates in the first place, read The Capacity Paradox.

Leave a Reply