
Critical chain works well for one project. In a shared pool, it cannot see what each rescue costs.
The video above tells this story in a minute. Below is the whole story.
Every year starts the same way. The annual plan is signed, the teams begin with fresh energy, and the portfolio report is green from top to bottom. It stays green through the spring, and every month your project managers report green again. Then, somewhere after the summer, one project goes red. No worries, all the others are still fine. Then a few more. Still manageable. But within a few weeks, almost the entire portfolio is red. Your best people run from project to project to put out fires, and every fire they put out seems to light another. None of the red projects comes back.
Late projects are nothing new. What strikes most managers is how long everything looked fine, and how suddenly it all fell over. When I was a young critical chain consultant, working in companies that ran many projects at once, this happened to me more than once, and it took me a while to understand it.
What went wrong over the summer?
Picture 40 projects that share the same engineers, in a plan that keeps those engineers fully booked. In June all 40 are green. By October 30 are red. Before you read on: what do you think happened in July and August?
Most people look for an event in the summer: the holidays, a key engineer who left, a customer who changed the scope, a batch of new projects. In the portfolios where I saw this pattern, the cause was not in the summer at all. The damage was done in the spring, while every project was still green, by people doing exactly what they were supposed to do.
How can doing the right thing sink a portfolio?
Start with what green actually measures. Critical chain, the method Eliyahu Goldratt developed [1], is an excellent way to run a single project. It takes the safety margin out of each task and pools it where it protects the whole project: a project buffer at the end of the longest chain of dependent work, the critical chain. Where a shorter chain of work joins it, for instance the software that has to be ready before the integration test, a smaller feeding buffer protects the join. The fever chart shows the health of the project: how much of the project buffer is used, compared with how far the critical chain has come, in green, yellow or red. For one project with its own team this works well, far better than percent complete (The Watermelon Report explains why).
Now let the projects share their people. One project, call it B, slips and turns yellow. The rule in critical chain, and in plain common sense, is to give the scarce person to the work whose buffer is most consumed [2]. Here, that is B. Where does that person come from? Not from another project's critical chain, because that would turn the other project red. They come from a feeding chain in another project, call it A, work that still has time to spare. After the move, project B is back in the green. Project A is still green, because its critical chain was not touched. Only A's feeding buffer has changed: it has gone from green to yellow. On the fever chart, nothing is wrong (Figure 1). In the progress meeting everybody looks at the critical chains, and they look fine. Everyone did the right thing.
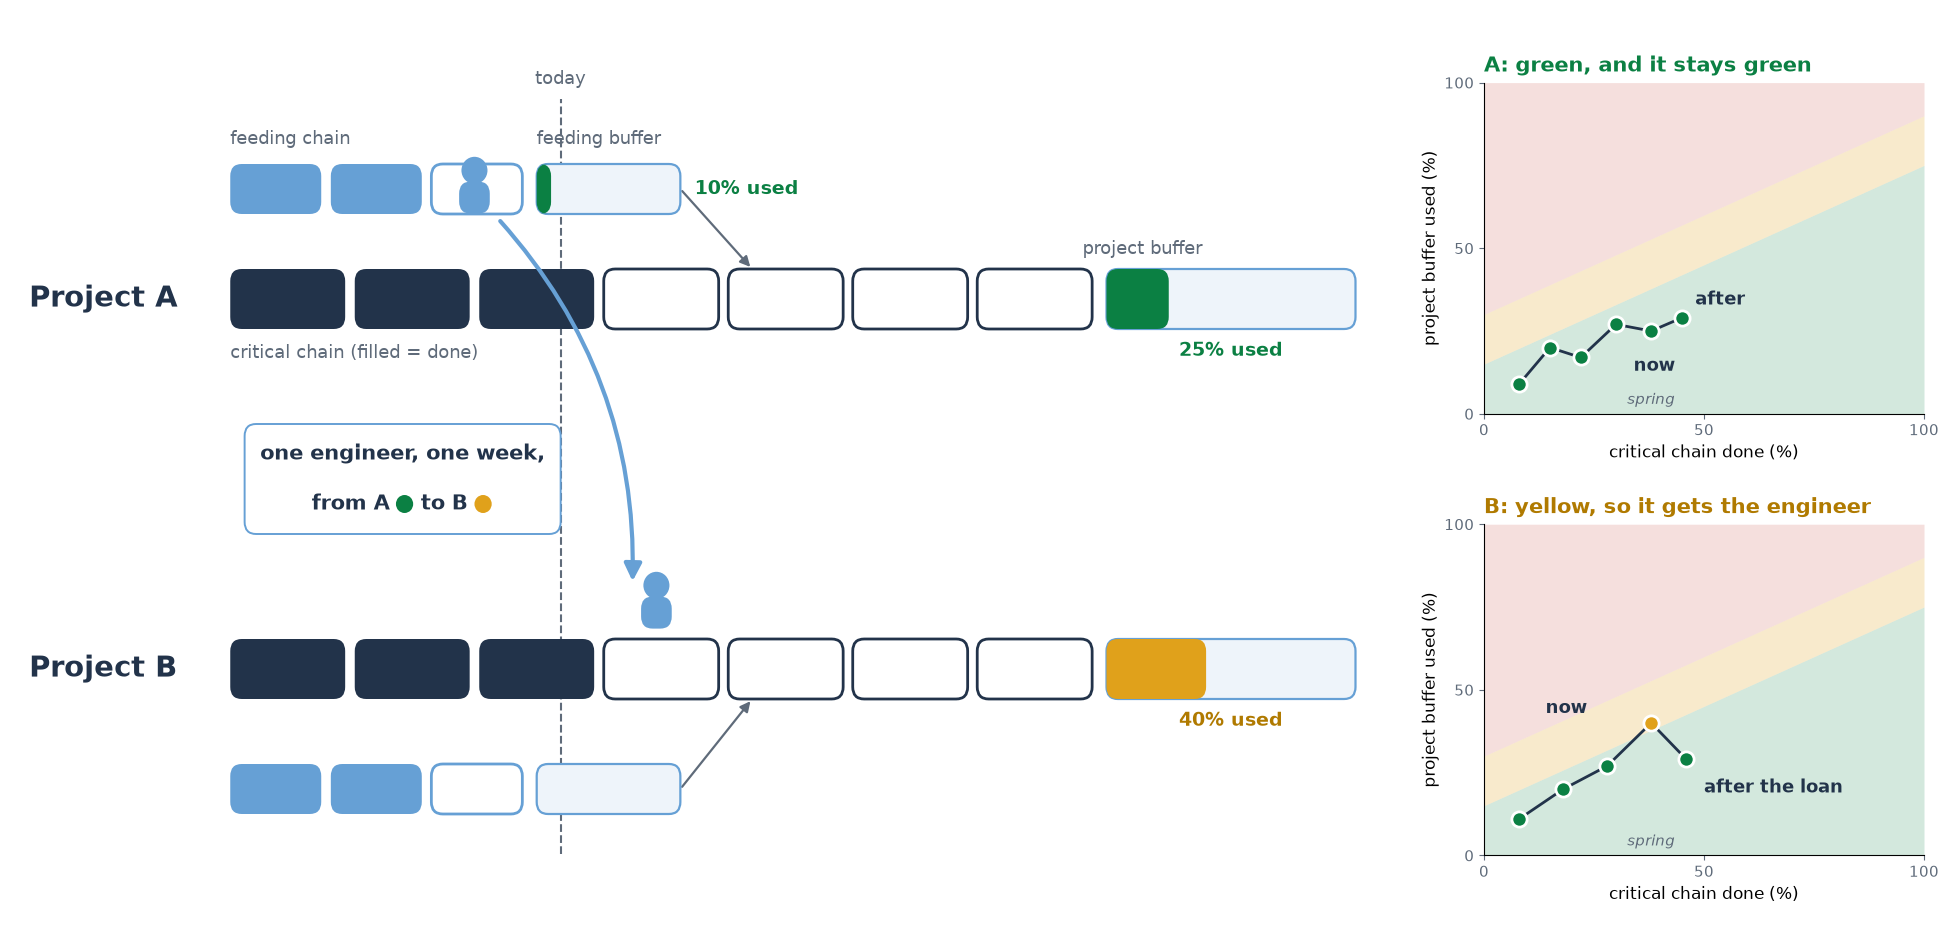
Look at what has changed. Critical chain was designed for one project with its own team, where one manager sees both chains and can weigh the trade. In a shared pool the loan crosses a project boundary: the gain shows up in one project's report, the cost in another project's feeding buffer. You cannot even be sure any more what a project's critical chain is, because whether an engineer is free next week depends on every other project that needs them.
What does one loan cost?
The week the engineer was away, the feeding chain they left behind used a week of its buffer. In a team with spare hours, that week would be made up later. In a pool that is already full, it never is: the engineer comes back to a queue. Repeat this for a few months, across all the projects that lend to and borrow from each other, and the feeding buffers drain, one loan at a time, from green to yellow to red, until the feeding chains have eaten all their buffer. A feeding chain whose buffer is gone is as long as the critical chain: any further delay on it delays the whole project. It has become critical.
Willy Herroelen and Roel Leus found the same when they put critical chain to the test. Using up a buffer often creates a conflict over the same people somewhere else, and resolving that conflict can make other chains as long as, or longer than, the critical chain you set out to protect. In their experiment, one schedule update in three ran into such a conflict, and they add that their criticism holds just as much when many projects share their people [3].
And the fever chart shows none of this. It plots the project buffer against the critical chain, so a project can sit in the green while its feeding buffers run empty one by one. The first sign on the chart is a feeding chain that has already become critical, and by then the project jumps from green to red in a few weeks. Now look at the next request (Figure 2). B has again used a little more of its project buffer than A, so the rule says: send A's engineer to B once more. But A's feeding chain has hardly any buffer left. One more loan and it becomes critical, and the fever chart will only show the damage weeks later.
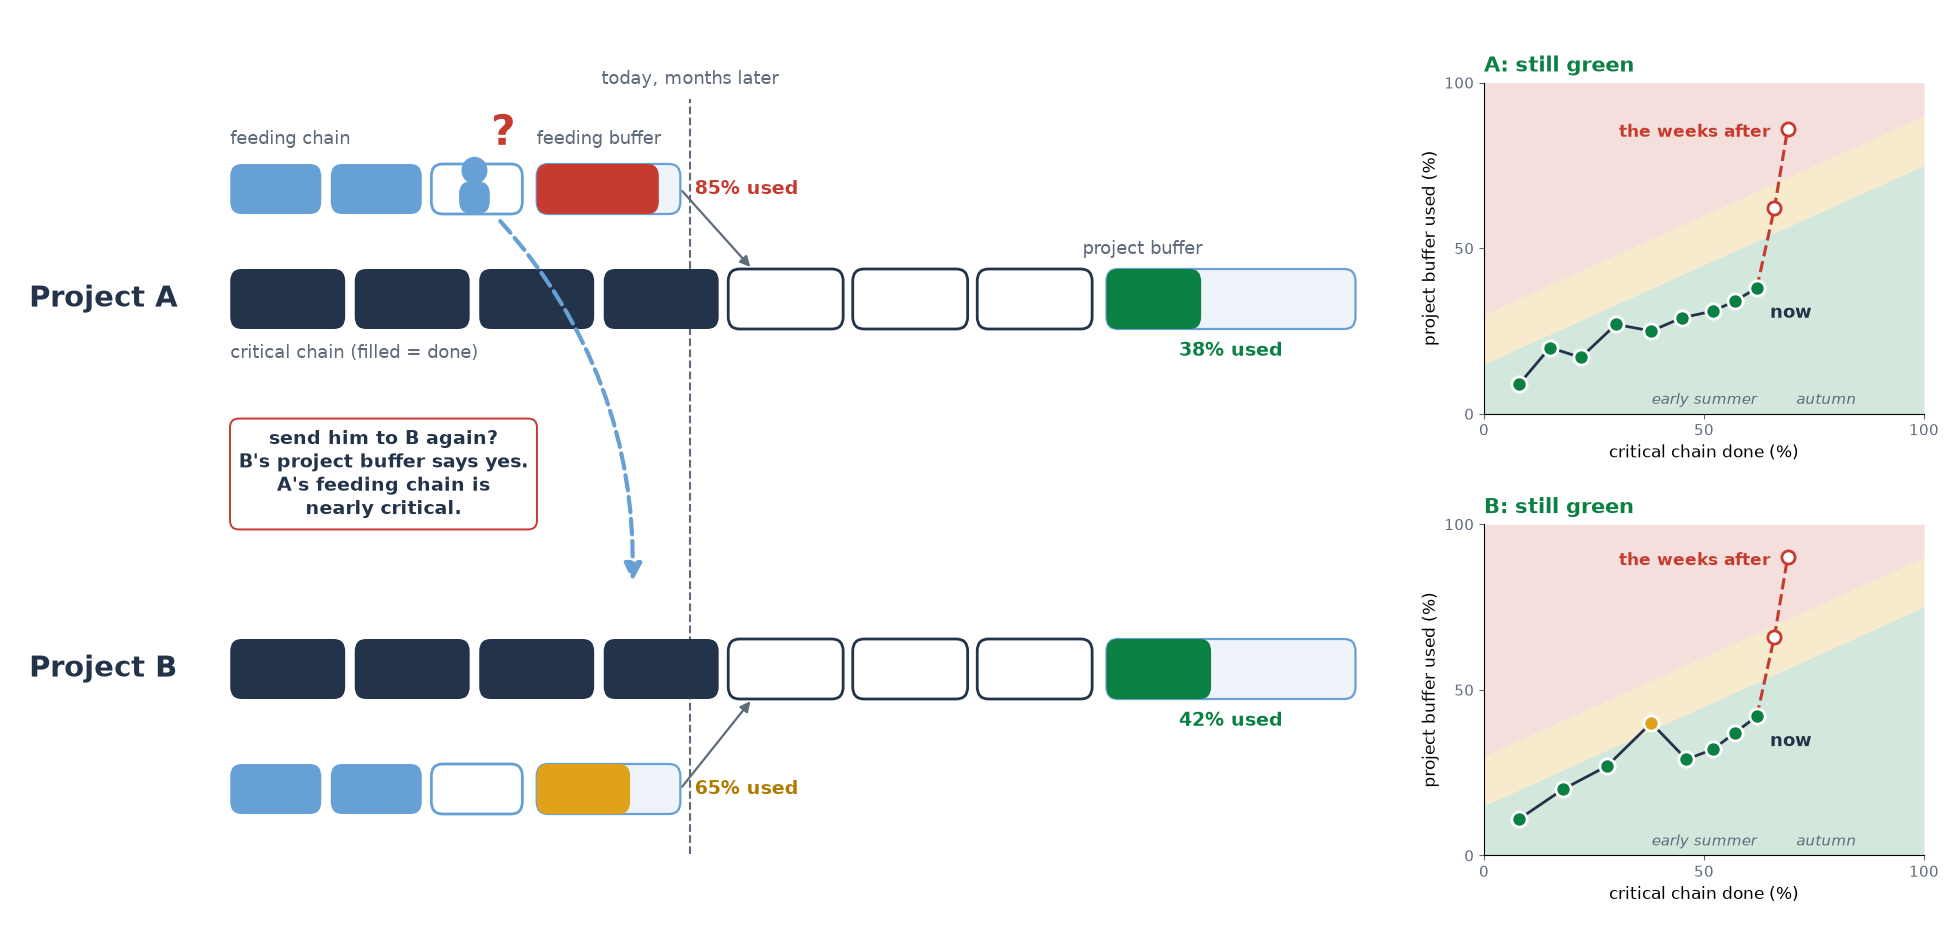
Now picture this across all 40 projects. While the report stays green, more and more chains are critical or close to it, out of sight. The air is going out of the plan.
Why does it all fall at once?
The first time a feeding chain runs dry, the project has two critical chains instead of one. Then three. One extra person no longer helps, because whichever chain you help, another one is just as late. The project now needs a whole group of people. And it turns red in the same weeks as the other projects that lent and borrowed from the same pool, because their buffers drained the same way, over the same months. Every red project needs the same people, and there is nothing left to borrow. Each rescue now opens a new hole somewhere else (The Expedite Tax puts a price on those holes).
The portfolio stayed green because we were spending its feeding buffers to keep it green.
Flow Economics calls this the borrowed buffer: every rescue borrows time from a feeding chain in another project, and nobody keeps the books. Its result is what I call "once in red, always in red": in a shared pool, a red project rarely catches up, because the help it needs is the same help every other red project needs. Nelson Repenning and his colleagues found the same trap in product development: once people are pulled into firefighting past a tipping point, the firefighting keeps itself going [4]. And it is where critical chain reaches its limit: it works in the time domain, project by project, while the trouble sits in the resource domain, with the people the projects share.
What does Flow Economics do instead?
Two things, and neither needs a better critical chain.
First, it puts a price on the loan. A project is an investment, and every week it finishes later is a week of return the organization does not get. Flow Economics calls that price drag cost (Drag Cost). Drag cost is not the same for every project. It depends on the project's revenue and on bonus and penalty costs (The Shape of Delay). Each rescue moves a delay from one project to another, so each rescue has a price on both sides. With those prices on the table, "send the engineer to B" is no longer a rule. It is a sum: is B's gain worth more than the delay it moves into A?
Second, next to the time domain of the projects, it watches the resource domain: the load on the people. Managing a portfolio project by project creates friction across the people those projects share (What Flow Economics Is). What is critical is the load on each group of people across all projects, over time, and an overloaded group shows in that load long before any buffer turns red. So start projects a few at a time, the most valuable first, based on the resource load (When Every Project Is Priority One). With fewer projects running at once, there is less to rescue and less to borrow. And the projects that matter most finish first: every week they come in earlier is a week of return the organization gains.
Back in the spring
Remember the report at the start of this story: green from top to bottom, all spring long. Every rescue in that spring worked. An engineer moved, a deadline held, a report stayed green. That was the problem. Each rescue was a loan from another project, and after the summer all the loans came due at once.
References
- Goldratt, E. M. (1997). Critical chain. North River Press.
- Cohen, I., Mandelbaum, A., & Shtub, A. (2004). Multi-project scheduling and control: A process-based comparative study of the critical chain methodology and some alternatives. Project Management Journal, 35(2), 39-50. https://doi.org/10.1177/875697280403500206
- Herroelen, W., & Leus, R. (2001). On the merits and pitfalls of critical chain scheduling. Journal of Operations Management, 19(5), 559-577. https://doi.org/10.1016/S0272-6963(01)00054-7
- Repenning, N. P., Gonçalves, P., & Black, L. J. (2001). Past the tipping point: The persistence of firefighting in product development. California Management Review, 43(4), 44-63. https://doi.org/10.2307/41166100



Leave a Reply