
The video above tells this story in a minute. Below is the whole story.
You started 2026 with a good annual plan. During the year more projects came in, the kind you could not say no to, until every project was priority one and every team was torn between competing priorities. By the autumn it had turned into chaos: far too few projects delivered, the financial targets missed, and the whole company under stress. And the next planning round is already here. So what will you do differently in 2027?
Look closer and the pattern is familiar. The same few names were on every project, everyone was busy all year, and the dashboards stayed green until the dates started to slip. I had a case just like it during my PhD research [1], in the innovation department of a mid-sized manufacturer of climate and building automation systems. Its engineers were working on 23 projects at once.
What did it take to fix it?
The people had felt it long before anyone measured it. The engineers said they "don't get anything done". Management said nothing ever came out of the department. Projects were late, the teams were exhausted, and every new opportunity was added on top of the rest, because customers cannot wait forever and nothing in the queue was ever finished to make room [2].
So first we made the overload visible. We loaded all active projects into the planning system. Take one of the two engineering groups: seven engineers, about five FTE of effective capacity. In the first weeks of the plan it had, on average, five FTE more work than it could do, twice its capacity, with peaks above eight. The other group was worse off still. Even in the most optimistic view, the team would need 17 weeks just to catch up.
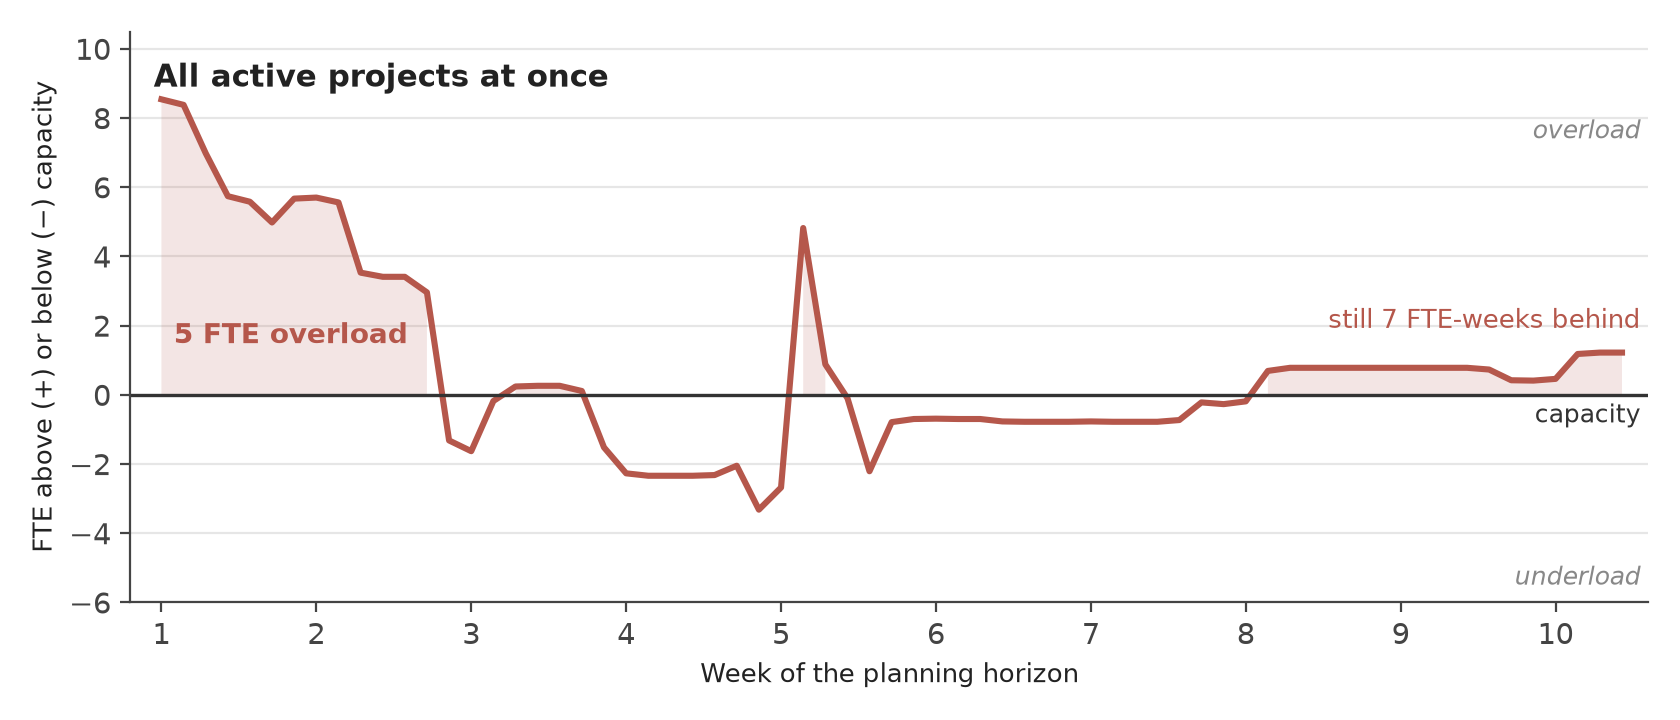
Before you read on: what would you do to turn this around? More people, fewer projects, or neither?
Most organizations hire more people, and find it hard to say no to projects (Nine Lame Excuses for Not Killing Projects). But add people to a process that is not under control, and you end up in more chaos. It was neither.
To turn this around, I put the load graph in front of the CEO and asked him for one thing: a priority for each of these 23 projects. "We have that," he said. He opened his laptop, looked at the priority list and closed it again at once. I asked him what was wrong. He answered:
"All 23 projects have priority one."
Then, after a pause: "It's clear that you want to see number 1 to 23 here." That was the moment he saw it himself: this was a management problem, not an execution problem.
A week later the list was there, 1 to 23, ranked by what each project would bring the company, and the CEO backed it. Anyone who asked why their project had not started yet was told to wait, a firm decision backed by the management team. From then on each engineer worked on one project at a time instead of five, the team as a whole on two or three, and the next project on the list started as soon as there was room. Nothing was dropped and nobody was hired.
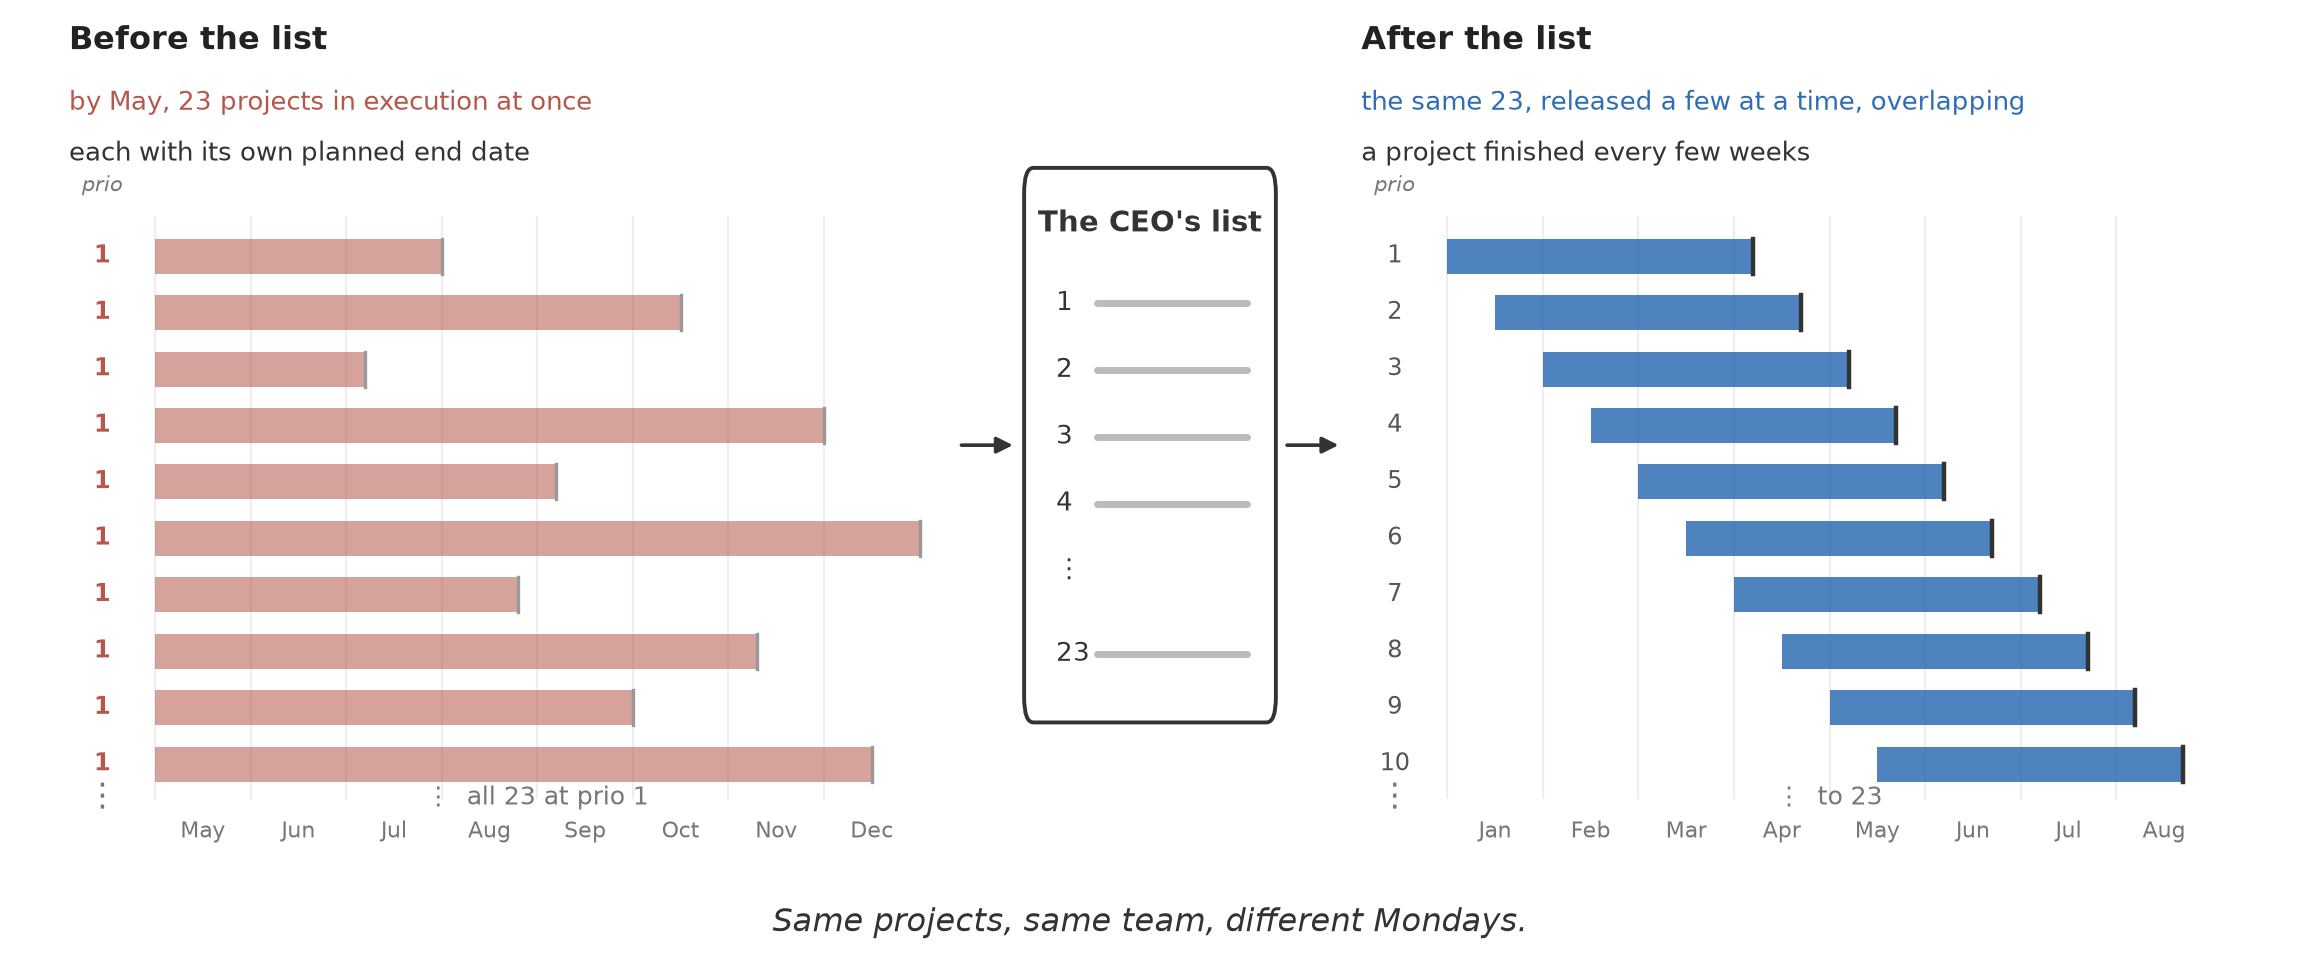
In the new plan the team was even a little underloaded instead of overloaded, and that was on purpose. The team knew it was not yet good at planning and delivering to plan, so it did not plan itself full again. And new work always comes in between: a customer problem, an urgent change, a test that has to be redone. That work now had room.
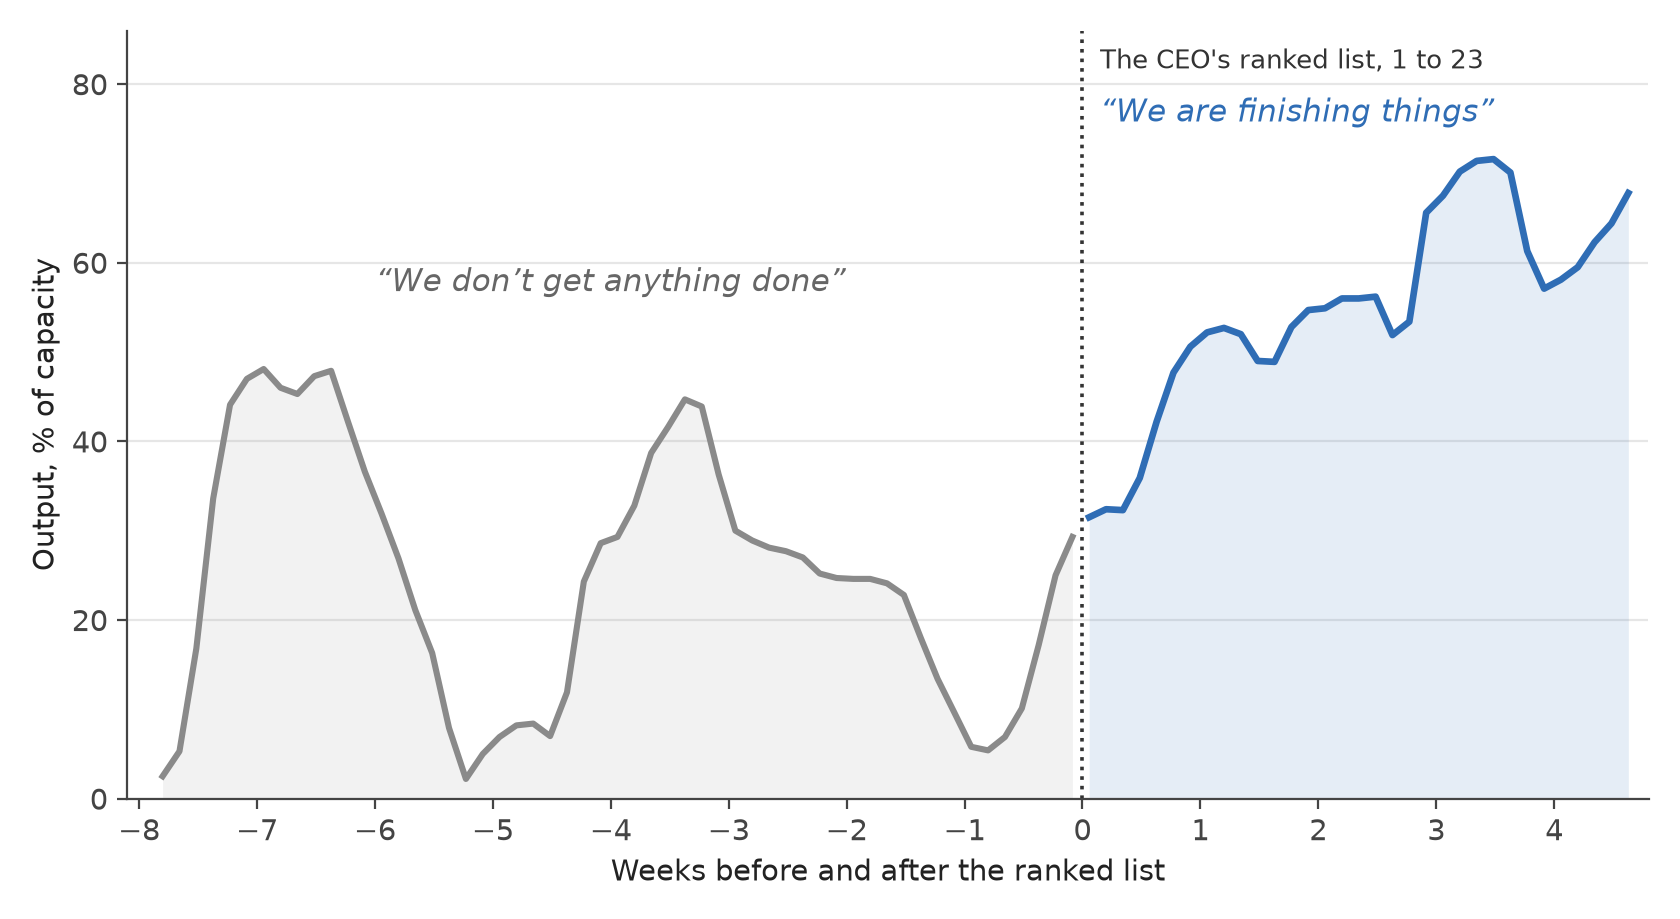
Within five weeks, everything had turned around
What astonished me, and the whole company, was how fast we turned the company around. The output of the team doubled, and we could measure it in hard figures [1, pp. 176-178].
The mood changed with it. The engineers were happy to be delivering again. The CEO was happy too, because he saw projects completed, and sales could finally tell customers when something would arrive. And the projects that came out first were the ones at the top of the list: the projects worth the most were delivered first, and much earlier than when everything ran in parallel. A project that finishes months earlier pays out months earlier, and that goes straight to the bottom line. It is what the CEO had wanted from the start.
None of this is rocket science, and it needed no better data than the plan already had. It needed an agreement on how many projects a team works on at the same time, two or three [3], and a list that says which ones come first. Above all, it needed the CEO and his management team to take the lead and own that list, instead of doing what most management teams do: blame the floor for being slow.
Why did it work?
The same engineers, the same hours, and five weeks later a team that delivers. Why?
Start with how 23 projects ended up running at once. The annual plan did spread them over the year. But during the year things change, and things go wrong. The running projects take longer than planned. New work comes in between and makes them take longer still. Meanwhile the next projects in the plan are waiting, and their start was promised, so people push to start them, and they are started. Repeat that a few times and 23 projects run in parallel. Nobody chose it; the plan was followed while reality moved on.
That is the core of the problem. Most organizations steer by the plan, not by what is happening on the floor right now. A plan for the year is fine, but it has to be a living plan: look at the current situation every few weeks and set the priorities again. Skip that, and you end up where this company was.
What does that do to a team? A team finishes a fixed number of hours a week; in Scrum terms, it has a certain velocity. Work above that is not done faster. It waits. With 23 projects open, every project waits for the same people, and the engineers switch from one to the next all day (Why Your Best People Should Do One Thing at a Time shows what that switching costs). Work on five projects at once, and each one takes at least five times as long [4, 5]. No wonder everyone felt that nothing was ever delivered.
The planning system showed the waiting as overload in FTE, and the company read it as a shortage of people. It was a queue. A project pays out only when it is finished, so for months the portfolio paid out almost nothing while every dashboard showed activity. Little's Law puts it in one line: the more work in progress, the longer each piece of it takes [6].
Now take the same projects a few at a time. The queue has not gone away; it has moved from the engineers' desks into the plan, as a list of start dates. The sponsor of the project at the bottom of the list lost nothing but the appearance of progress: an honest start later in the year, instead of an early start that never got the team's attention.
So the team was never short of people. The plan said yes 23 times and never once said when. An overloaded team is usually a release decision nobody took. Approving a project decides whether it is worth the money. Releasing it decides when people start. Most plans take the first decision with care and let the second one happen by default: whenever a planned start date comes up, or someone pushes hard enough. Flow Economics calls that second decision the Sequencing Decision, and starting projects a few at a time, as the team has room, is staggering. The CEO's list was that decision, taken on purpose for the first time.
That makes it a decision for management, not for the project manager, who is given an impossible job the moment a team is spread over five projects. It pays management back as well: once the order is set, the CEO only has to watch the few projects at the top, not all 23. That matters more than it sounds: Goldratt came to see management attention as the ultimate constraint of an organization [7]. In the companies that make this stick, someone owns the decision, a gatekeeper who lets the next project through only when the people it needs have room. That is also the answer to the projects you could not say no to: they can have their yes, just not this Monday.
How does Flow Economics value the list?
Flow Economics reads the CEO's list as an investment decision. Each project on it is an investment, so the order of the list is the order in which the money comes back.
What should set that order? Not what a project has cost so far: that money is spent, whatever you decide. What counts is what it still takes to finish a project, and what it will return once it is finished: its return on the remaining investment (RRI). For this, Flow Economics has embraced the method of Stephen Devaux, who has long argued that projects should be managed as investments. RRI is the Flow Economics name for Devaux's DIPP [8]. In this case the scarcest part of that cost was the time of the people every project needed. So rank the projects by what each one returns per hour of those people (Value per Constrained Resource Hour), and "every project is priority one" becomes an order you can defend.
That is where management and finance meet. Whoever sets the order of the work also sets the return on the portfolio.
Five weeks later
The team leader put it in four words: "We are finishing things." The CEO opened his laptop, looked at the priority list, and agreed: his top-priority projects were already delivered.
References
- Ponsteen, A. (2022). Resource allocation in multi-project environments by combining scheduling heuristics with human intelligence [Doctoral dissertation, Open Universiteit]. https://research.ou.nl/ws/files/53248143/2022_Thesis_Albert_Ponsteen_v3.4_with_cover.pdf
- Repenning, N. P., Gonçalves, P., & Black, L. J. (2001). Past the tipping point: The persistence of firefighting in product development. California Management Review, 43(4), 44-63. https://doi.org/10.2307/41166100
- Anavi-Isakow, S., & Golany, B. (2003). Managing multi-project environments through constant work-in-process. International Journal of Project Management, 21(1), 9-18. https://doi.org/10.1016/S0263-7863(01)00058-8
- Leroy, S. (2009). Why is it so hard to do my work? The challenge of attention residue when switching between work tasks. Organizational Behavior and Human Decision Processes, 109(2), 168-181. https://doi.org/10.1016/j.obhdp.2009.04.002
- Colicev, A., Hakkarainen, T., & Pedersen, T. (2023). Multi-project work and project performance: Friends or foes? Strategic Management Journal, 44(2), 610-636. https://doi.org/10.1002/smj.3443
- Little, J. D. C. (1961). A proof for the queuing formula: L = λW. Operations Research, 9(3), 383-387. https://doi.org/10.1287/opre.9.3.383
- Goldratt-Ashlag, E. (2023). Goldratt's rules of flow. North River Press.
- Devaux, S. A. (1992). When the DIPP dips: A P&L index for project decisions. Project Management Journal, 23(3), 45-49. https://www.pmi.org/learning/library/economic-consideration-devaux-index-reject-performance-5343

Leave a Reply